介绍可口可乐(Coca-Cola)和百事可乐(PepsiCo)是软饮料行业的知名品牌,两家公司均跻身《财富》500强。在竞争激烈的市场中拥有广泛产品线的公司彼此之间存在着激烈的竞争,并在随后的几乎所有垂直产品市场中不断争夺市场份额。通过从每家公司的官方推特下载5000条推文来分析这两家公司的客户情绪,并在R中进行分析。在这一分析中,我们可以了解如何从品牌的社交媒体参与(在本例中为推特)中分析客户情绪。目录涉及的软件包及其应用什么是情绪分析?清除文本词云在一天和一周内发布推文推特数据的情感评分客户推特的情感分析结论R中使用的软件包
什么是情绪分析?情感分析是一种文本挖掘技术,它为文本提供上下文,能够从主观抽象的源材料中理解信息,借助Facebook、Instagram等社交媒体平台上的在线对话,帮助理解对品牌产品或服务的社会情感,推特或电子邮件。众所周知,计算机不理解我们的通用语言,为了让他们理解自然语言,我们首先将单词转换成数字格式。接下来我们将尝试一步一步地去实现这一过程。清除文本我们已经从Twitter下载了数据集,由于推特的文本形式包含了链接、hashtags、推特er句柄名称和表情符号,为了删除它们,我们在R中编写了函数ions。删除这些无用信息后,所有文本都将转换为小写,删除英语中没有意义的停止词(如冠词、介词等)、标点符号和数字,然后再将它们转换为文档术语矩阵。文档术语矩阵:是一个矩阵,包含每个单词在每个文档上出现的次数。removeURL <- function(x) gsub(“(f|ht)tp(s?)://S+”, “”, x, perl=T)
removeHashTags <- function(x) gsub(“#S+”, “”, x)
removeTwitterHandles <- function(x) gsub(“@S+”, “”, x)
removeSlash <- function(x) gsub(“n”,” “, x)
removeEmoticons <- function(x) gsub(“[^x01-x7F]”, “”, x)
data_pepsi$text <- iconv(data_pepsi$text, to = “utf-8”)
pepsi_corpus <- Corpus(VectorSource(data_pepsi$text))
pepsi_corpus <- tm_map(pepsi_corpus,tolower)
pepsi_corpus <- tm_map(pepsi_corpus,removeWords,stopwords(“en”))
pepsi_corpus <- tm_map(pepsi_corpus,content_transformer(removeHashTags))
pepsi_corpus <- tm_map(pepsi_corpus,content_transformer(removeTwitterHandles))
pepsi_corpus <- tm_map(pepsi_corpus,content_transformer(removeURL))
pepsi_corpus <- tm_map(pepsi_corpus,content_transformer(removeSlash))
pepsi_corpus <- tm_map(pepsi_corpus,removePunctuation)
pepsi_corpus <- tm_map(pepsi_corpus,removeNumbers)
pepsi_corpus <- tm_map(pepsi_corpus,content_transformer(removeEmoticons))
pepsi_corpus <- tm_map(pepsi_corpus,stripWhitespace)
pepsi_clean_df <- data.frame(text = get(“content”, pepsi_corpus))
dtm_pepsi <- documentTermMatrix(pepsi_corpus)
dtm_pepsi <- removeSparseTerms(dtm_pepsi,0.999)
pepsi_df <- as.data.frame(as.matrix(dtm_pepsi))
data_cola$text <- iconv(data_cola$text, to = “utf-8”)
cola_corpus <- Corpus(VectorSource(data_cola$text))
cola_corpus <- tm_map(cola_corpus,tolower)
cola_corpus <- tm_map(cola_corpus,removeWords,stopwords(“en”))
cola_corpus <- tm_map(cola_corpus,content_transformer(removeHashTags))
cola_corpus <- tm_map(cola_corpus,content_transformer(removeTwitterHandles))
cola_corpus <- tm_map(cola_corpus,content_transformer(removeURL))
cola_corpus <- tm_map(cola_corpus,content_transformer(removeSlash))
cola_corpus <- tm_map(cola_corpus,removePunctuation)
cola_corpus <- tm_map(cola_corpus,removeNumbers)
cola_corpus <- tm_map(cola_corpus,content_transformer(removeEmoticons))
cola_corpus <- tm_map(cola_corpus,stripWhitespace)
cola_clean_df <- data.frame(text = get(“content”, cola_corpus))
dtm_cola <- documentTermMatrix(cola_corpus)
dtm_cola <- removeSparseTerms(dtm_cola,0.999)
cola_df <- as.data.frame(as.matrix(dtm_cola))
词云wordcloud是测试数据的一种表示形式,它通过增加测试数据的大小来突出显示最常用的单词,该技术用于将文本可视化为图像,是单词或标签的集合。在R中,可以使用worldcloud2包来实现,以下是它的输出代码。word_pepsi_df <- data.frame(names(pepsi_df),colSums(pepsi_df))
names(word_pepsi_df) <- c(“words”,”freq”)
word_pepsi_df <- subset(word_pepsi_df, word_pepsi_df$freq > 0)
wordcloud2(data = word_pepsi_df,size = 1.5,color = “random-light”,backgroundColor = “dark”)
word_cola_df <- data.frame(names(cola_df),colSums(cola_df))
names(word_cola_df) <- c(“words”,”freq”)
word_cola_df <- subset(word_cola_df, word_cola_df$freq > 0)
wordcloud2(data = word_cola_df,size = 1.5,color = “random-light”,backgroundColor = “dark”)
百事可乐和可口可乐的推特数据的词云
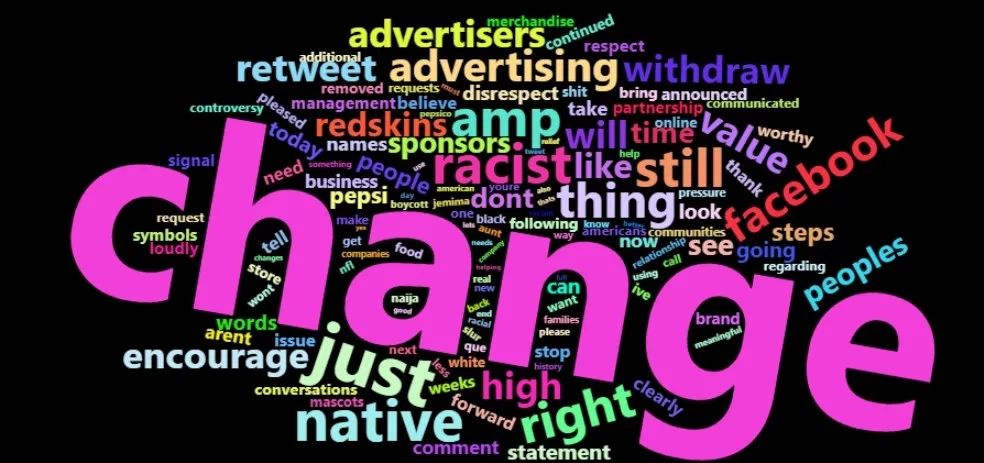
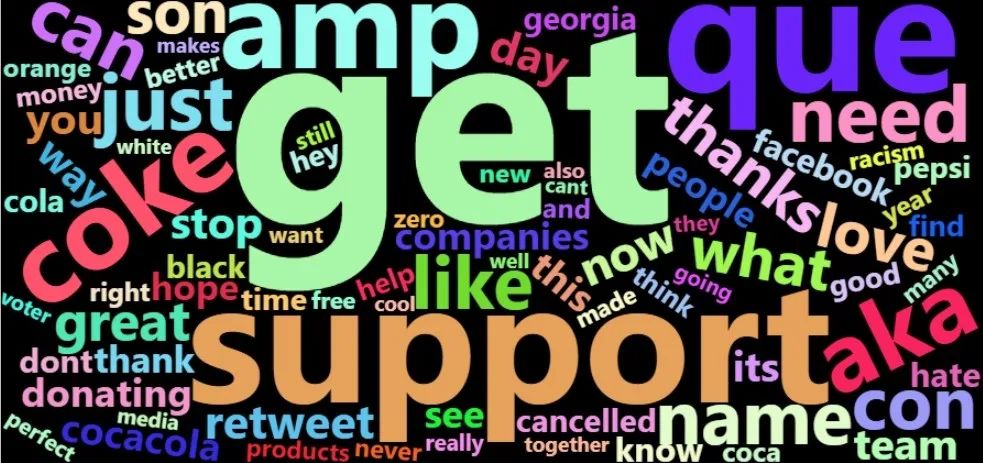
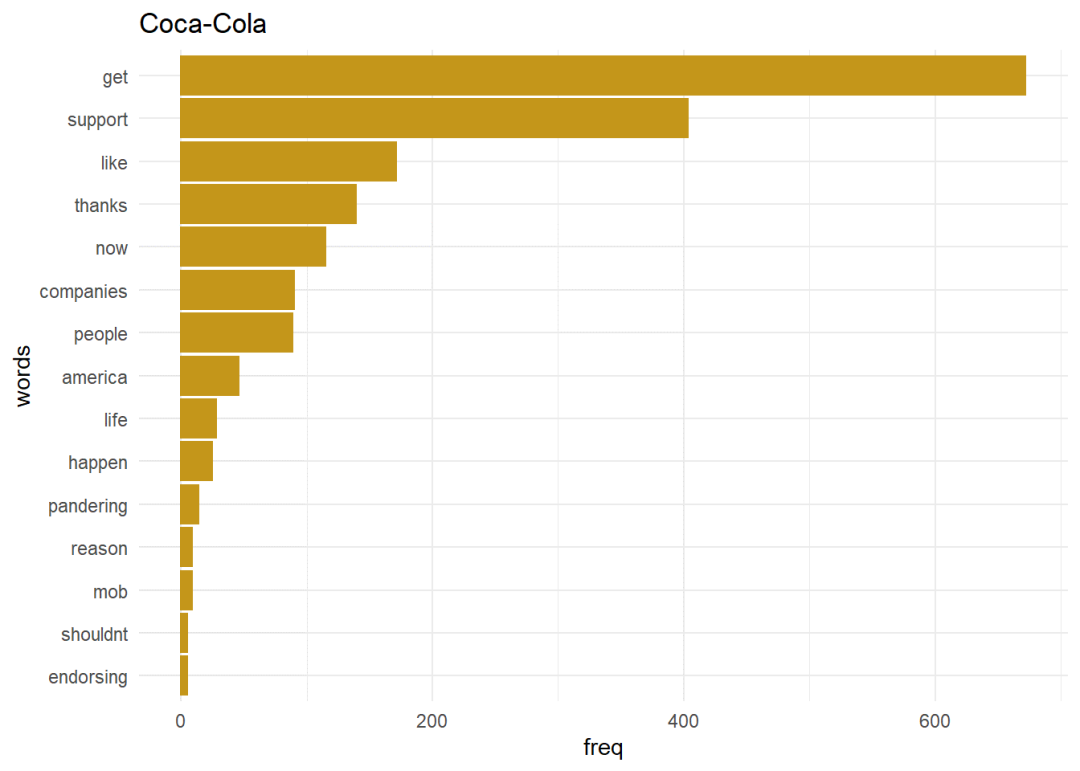
正如我们所知,词云中的词大小取决于其在推特中的频率,因此词会不断变化, just, native, right, racism很多出现在百事可乐客户的推特中,而get和support等词更多地出现在可口可乐客户的推特中。在一天和一周内发布推文由于推特收集的时间跨度超过一周,因此我们可以分析大多数用户活跃或用户在该品牌上发布最多推文的时间和工作日,这可以通过使用ggplot2库的折线图来可视化。下面是与输出一起使用的函数data_pepsi$Date <- as.Date(data_pepsi$created_at)
data_pepsi$hour <- hour(data_pepsi$created_at)
data_pepsi$weekday<-factor(weekdays(data_pepsi$Date),levels=c(“Monday”,”Tuesday”,”Wednesday”,”Thursday”,”Friday”,”Saturday”,”Sunday”))
ggplot(data_pepsi,aes(x= hour)) + geom_density() + theme_minimal() + ggtitle(“Pepsi”)
ggplot(data_pepsi,aes(x= weekday)) + geom_bar(color = “#CC79A7”, fill = “#CC79A7”) + theme_minimal() +ggtitle(“Pepsi”) + ylim(0,1800)
data_cola$Date <- as.Date(data_cola$created_at)
data_cola$Day <- day(data_cola$created_at)
data_cola$hour <- hour(data_cola$created_at)
data_cola$weekday<-factor(weekdays(as.Date(data_cola$Date)),levels=c(“Monday”,”Tuesday”,”Wednesday”,”Thursday”,”Friday”,”Saturday”,”Sunday”))
ggplot(data_cola,aes(x= hour)) + geom_density() + theme_minimal() + ggtitle(“Coca-Cola”)
ggplot(data_cola,aes(x=
weekday)) + geom_bar(color = “#CC79A7”, fill = “#CC79A7”) + theme_minimal()
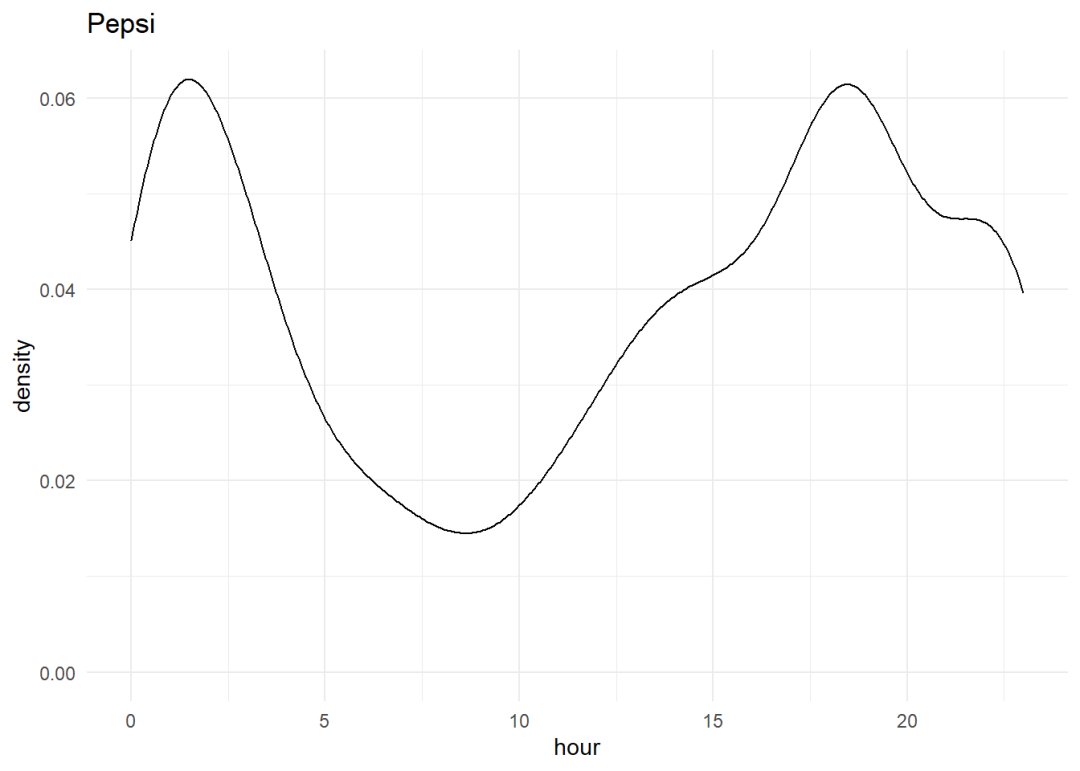
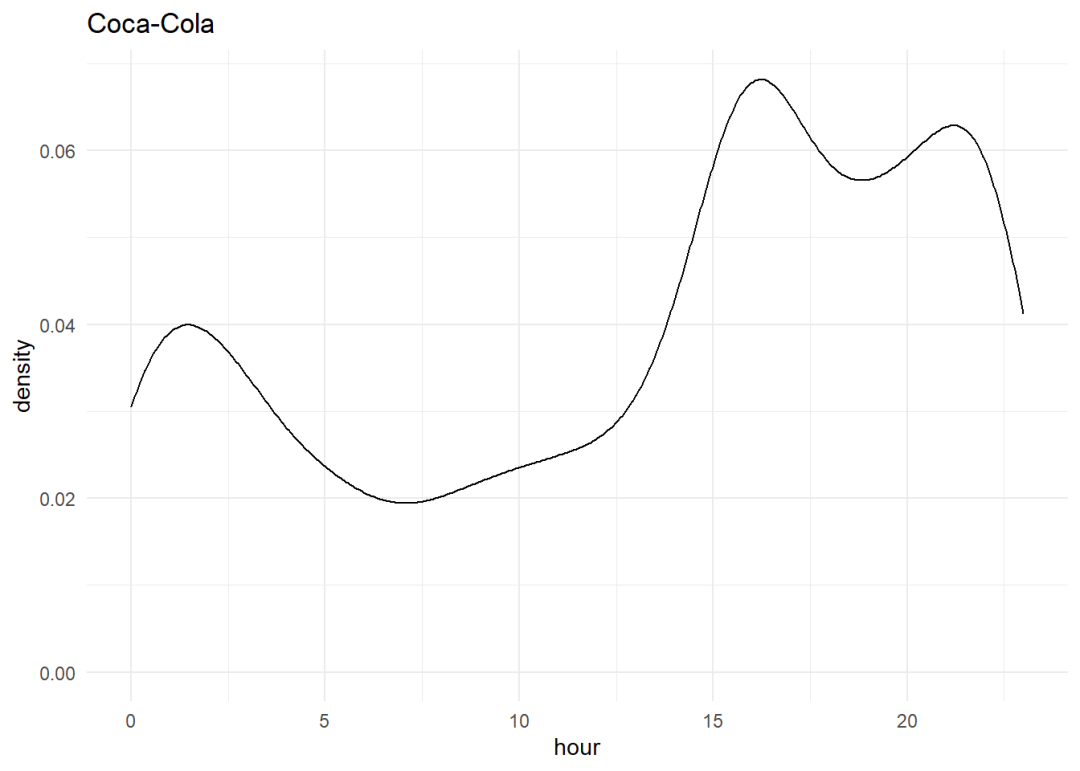
从上面的图表中,我们可以看到百事可乐和可口可乐在下午3-4点和凌晨1点左右都出现了峰值,因为人们喜欢在工作无聊或深夜使用社交媒体,这在我们的工作中是显而易见的。
一周内推特的分布情况
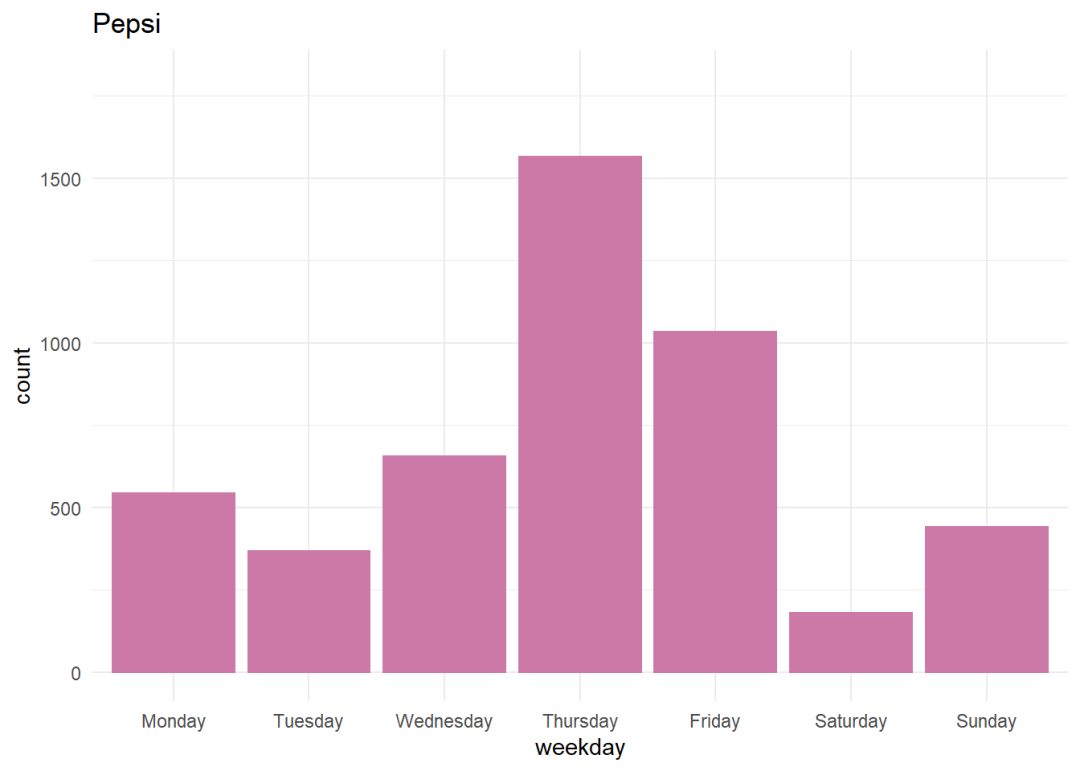
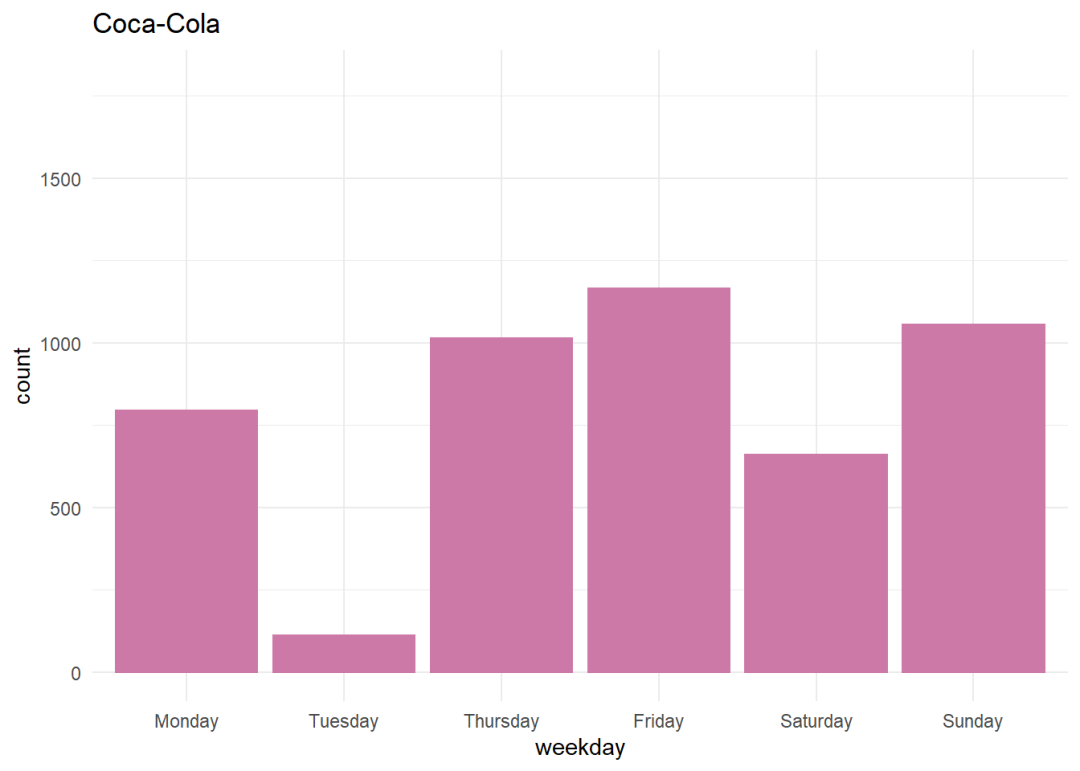
当每日推文显示在条形图上时,对于百事来说,周四是推特数量最多的一天,这是因为他们发布了季度报告,但就可口可乐而言,周二我们看到的推特数量最少。推特数据的情感评分在本节中,我们把推特数据分为积极的、消极的和中立的,这可以通过使用sendimentR包来实现,该软件包为每个词典单词分配一个从-1到+1的情感评分,并取推特中每个单词的平均值,得到每个推特的最终情感评分。sentiments <- sentiment_by(get_sentences(pepsi_clean_df$text))
data$sentiment_score <- round(sentiments$ave_sentiment,2)
data$sentiment_score[data_pepsi$sentiment_score > 0] <- “Positive”
data$sentiment_score[data_pepsi$sentiment_score < 0] <- “Negative”
data$sentiment_score[data_pepsi$sentiment_score == 0] <- “Neutral”
data$sentiment_score <- as.factor(data$sentiment_score)
ggplot(data,aes(x = sentiment_score)) + geom_bar(color = “steelblue”, fill = “steelblue”) + theme_minimal()
几乎75%的推特用户都持肯定态度,因为这两个品牌在他们的客户中相当受欢迎。顾客推特的情感分析推特的情绪是由Syuzhet软件包执行的,该软件包根据十个情绪指数对每个词典单词进行评分,包括愤怒、预期、厌恶、恐惧、喜悦、悲伤、惊讶、信任、消极和积极。如果我们把索引上每个词的值加起来,所有推特的情绪都可以用条形图表示。cols <- c(“red”,”pink”,”green”,”orange”,”yellow”,”skyblue”,”purple”,”blue”,”black”,”grey”)
pepsi_sentimentsdf <- get_nrc_sentiment(names(pepsi_df))
barplot(colSums(pepsi_sentimentsdf),
main = “Pepsi”,col = cols,space = 0.05,horiz = F,angle = 45,cex.axis = 0.75,las = 2,srt = 60,border = NA)
cola_sentimentsdf <- get_nrc_sentiment(names(cola_df))
barplot(colSums(cola_sentimentsdf),
main = “Coca-Cola”,col = cols,space = 0.05,horiz = F,angle = 45,cex.axis = 0.75,las = 2,srt = 60,border = NA)
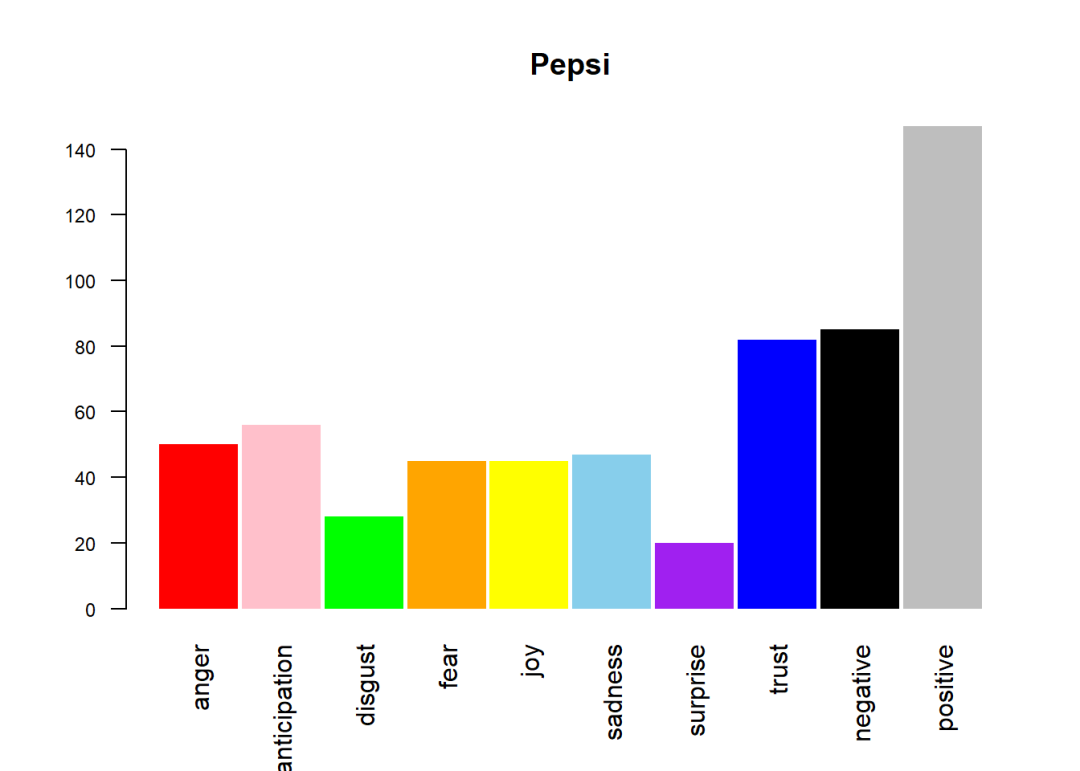
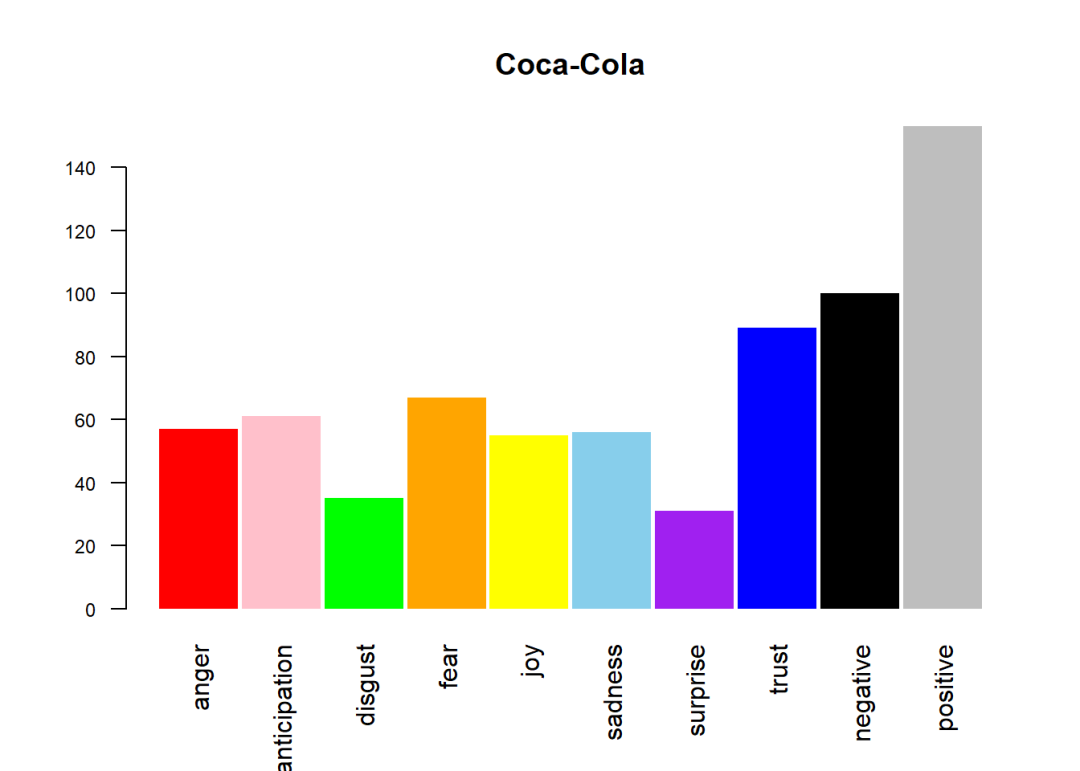
上面的输出是所有情绪在条形图上的显示,因为从条形图可以很清楚地看出,积极性对两家公司都起主导作用,这进一步加强了我们的上述假设。继续跟踪图表中的变化可以作为对新产品或广告的反馈。最常用词word_pepsi_df$words <- factor(word_pepsi_df$words, levels = word_pepsi_df$words[order(word_pepsi_df$freq)])
word_cola_df$words <- factor(word_cola_df$words, levels = word_cola_df$words[order(word_cola_df$freq)])
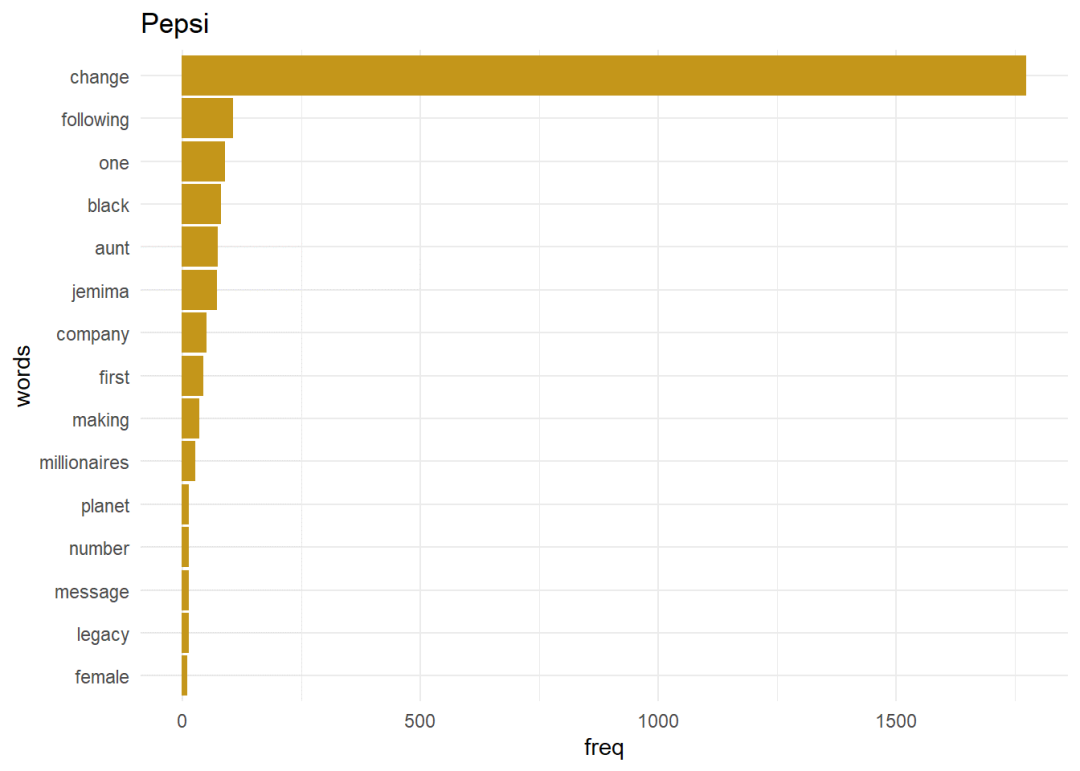
ggplot(word_pepsi_df[1:15,],aes(x = freq, y = words)) + geom_bar(stat = “identity”, color = “#C4961A”,fill = “#C4961A”) + theme_minimal() + ggtitle(“Pepsi”)
ggplot(word_cola_df[1:15,],aes(x = freq, y = words)) + geom_bar(stat = “identity”, color = “#C4961A”,fill = “#C4961A”) + theme_minimal() + ggtitle(“Coca-Cola”)
createNgram <-function(stringVector, ngramSize){
ngram <- data.table()
ng <- textcnt(stringVector, method = “string”, n=ngramSize, tolower = FALSE)
if(ngramSize==1){
ngram <- data.table(w1 = names(ng), freq = unclass(ng), length=nchar(names(ng)))
}
else {
ngram <- data.table(w1w2 = names(ng), freq = unclass(ng), length=nchar(names(ng)))
}
return(ngram)
}
pepsi_bigrams_df <- createNgram(pepsi_clean_df$text,2)
cola_bigrams_df <- createNgram(cola_clean_df$text,2)
pepsi_bigrams_df$w1w2 <- factor(pepsi_bigrams_df$w1w2,levels = pepsi_bigrams_df$w1w2[order(pepsi_bigrams_df$freq)])
cola_bigrams_df$w1w2 <- factor(cola_bigrams_df$w1w2,levels = cola_bigrams_df$w1w2[order(cola_bigrams_df$freq)])
names(pepsi_bigrams_df) <- c(“words”, “freq”, “length”)
names(cola_bigrams_df) <- c(“words”, “freq”, “length”)
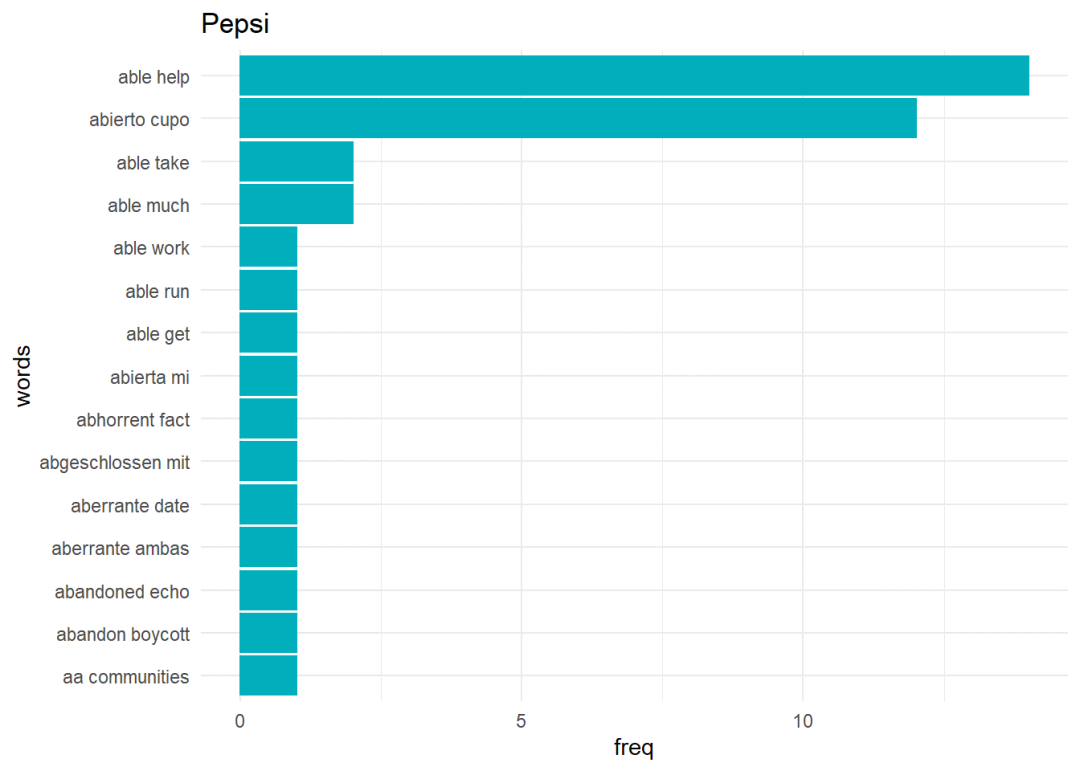
ggplot(pepsi_bigrams_df[1:15,],aes(x = freq, y = words)) + geom_bar(stat = “identity”, color = “#00AFBB”,fill = “#00AFBB”) + theme_minimal() + ggtitle(“Pepsi”)
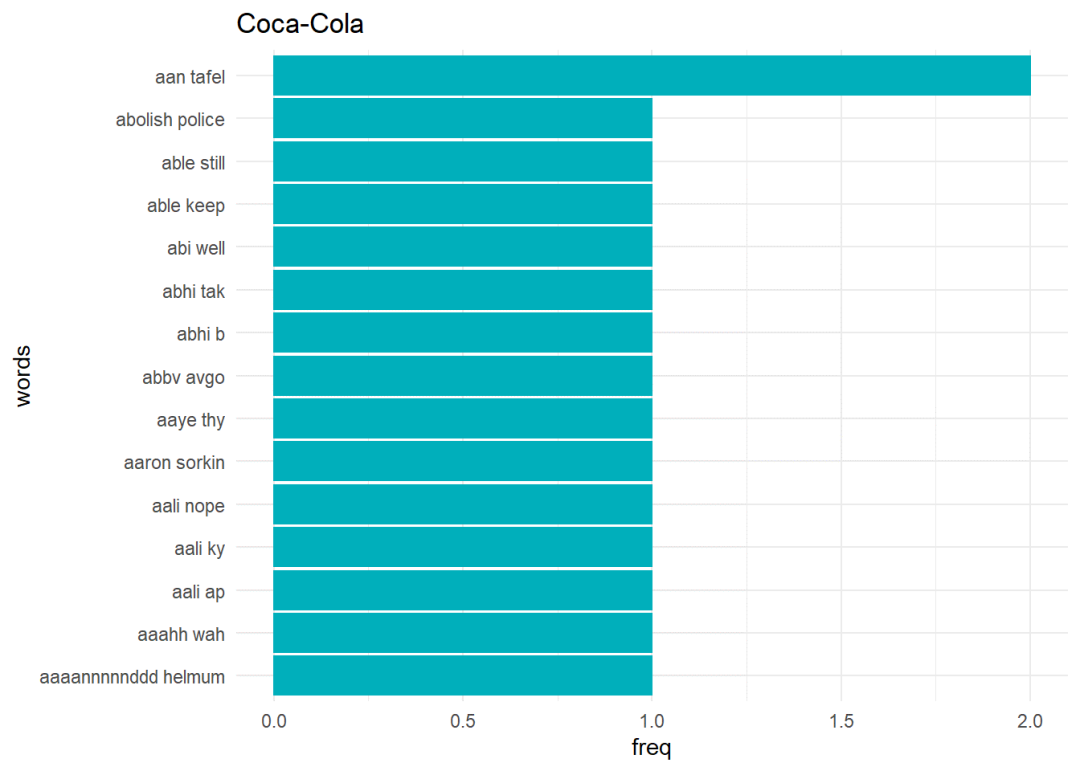
ggplot(cola_bigrams_df[1:15,],aes(x = freq, y = words)) + geom_bar(stat = “identity”, color = “#00AFBB”,fill = “#00AFBB”) + theme_minimal() + ggtitle(“Coca-Cola”)
二元语法二元语法是一对字词,当句子被拆分成两个字词时产生的。获取单词的上下文是有用的,因为单个单词通常不提供任何上下文。
结论我们可以看到,从现有的社交媒体参与度来看,公司可以分析客户的情绪,并据此制定业务战略,来用于制定公司决策(例如启动产品线)。